http://itl.nist.gov/div898/handbook/eda/section3/gif/starplot.gif
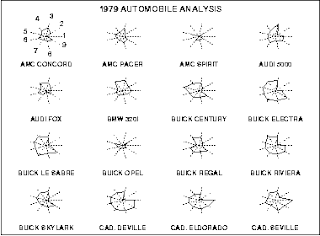
A star plot is used to examine relative values of a single data point. The other points vary depending on the single data point. This star plot represents 16 different automobile the larger the plot the more variables are associated with that particular car.

No comments:
Post a Comment