
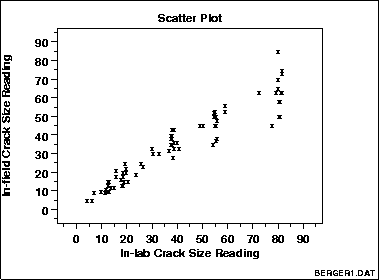
A scatter plot is a mathematical deptiction of the relationship between two sets of data. The more point that are located with one area indicates that the data is closely related at that given point. This scatter plot shows that in field and in lab reading of crack sizes are related in at differents points.
No comments:
Post a Comment